In order to answer this question first ….
Let’s quickly do some repetition. Let’s quickly do some repetition.
Let’s throw in some trading cliche’ terms.
The market does not move in a straight line.
The market is fractal in nature.
Each pattern repeats itself on several time frames.
The market moves in waves, some would bet their house that it moves in a perfect Elliott Wave sequence (hmmm)
If price always moves in waves then the most logical course of action would be to trade when the market takes a pause within a nice clean moving chart. We like to see a chart in a nice 45-degree move.
How do you define a pullback?
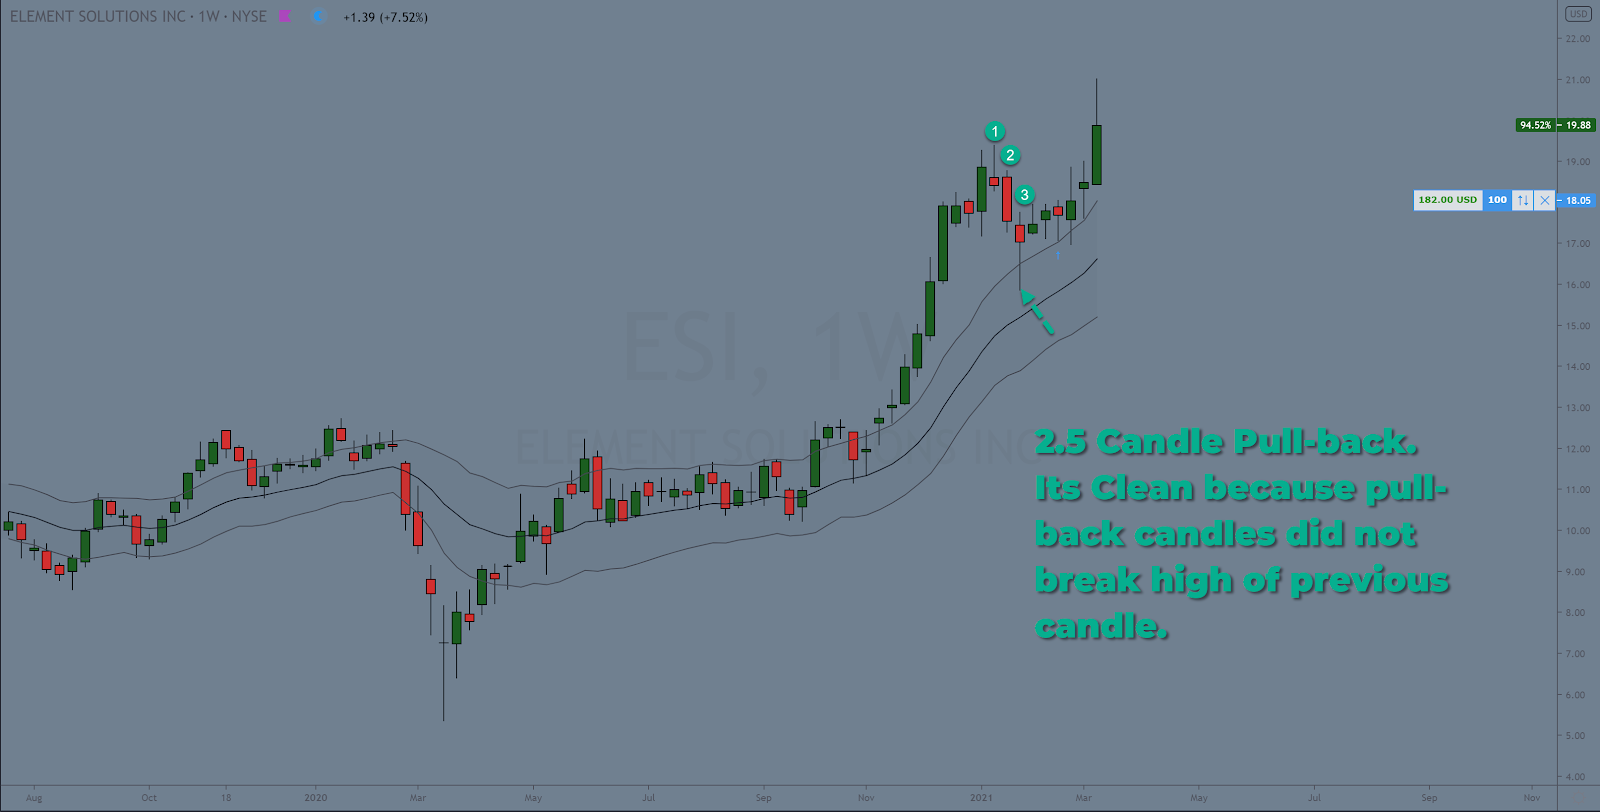
There are a few ways but to simplify it we will consider a pullback with a minimum of 3 candles and a maximum of 7 candles. (max can be subjective). But to keep it strictly objective, we would keep it to 3-7 candles and the price must stay above 20EMA.
Two Types of Pullbacks
Let’s agree here that we all understand that there are Two Types of Pullbacks

How many Pullbacks can I trader within a trend?
And the agreed answer to the question is to take the first or second pullback in a trend but not 3 or 4th. Note that it’s not an exact science. Sometimes even 3rd and 4th would be good but it will depend the trading time frame you have chosen.
This is a simple concept but as always there is a question of when to start counting?
So the question is where to start counting your pullbacks
The answer is simple but depends on two situations
To put it simply: the time to count is the time when you see the first initial breakout or the first turn around of a trend.
The trick is to simply understand where the TREND STARTED.
You can visually inspect this simply by looking at the chart or you can use an indicator for this
10/20 ema (The Hun 2.0)
AIMS Wave and Box and Gator(The Setup Indicators)
KC (The Hunt 1.0)
Number 1: The Hunt 2.0 - 10 / 20 EMA
In the case of 10/20 ema, your trend breakout or trend reversal will usually have an accompanying cross of the moving average
E.g. in this chart, (that I have randomly selected no special reason to show this ticker symbol whatsoever) I have marked where price turned around at the bottom after the pandemic crash down. It broke above the swing high to the left going above the moving averages. This was then followed by a pullback. You will also see I have marked the cross of the moving average.
And you will also be able to see that you could have seen it simply by looking at the price. But for people who can’t do this on the price chart alone, the 2 moving averages can be a big help.
I know its hard to know if the trend is starting right now at this moment when you’re at the right end of the chart at the current time. But when the breakout has already happened then it’s not that hard.
10/20 EMA Crossover Chart (The HUNT 2.0 Template)
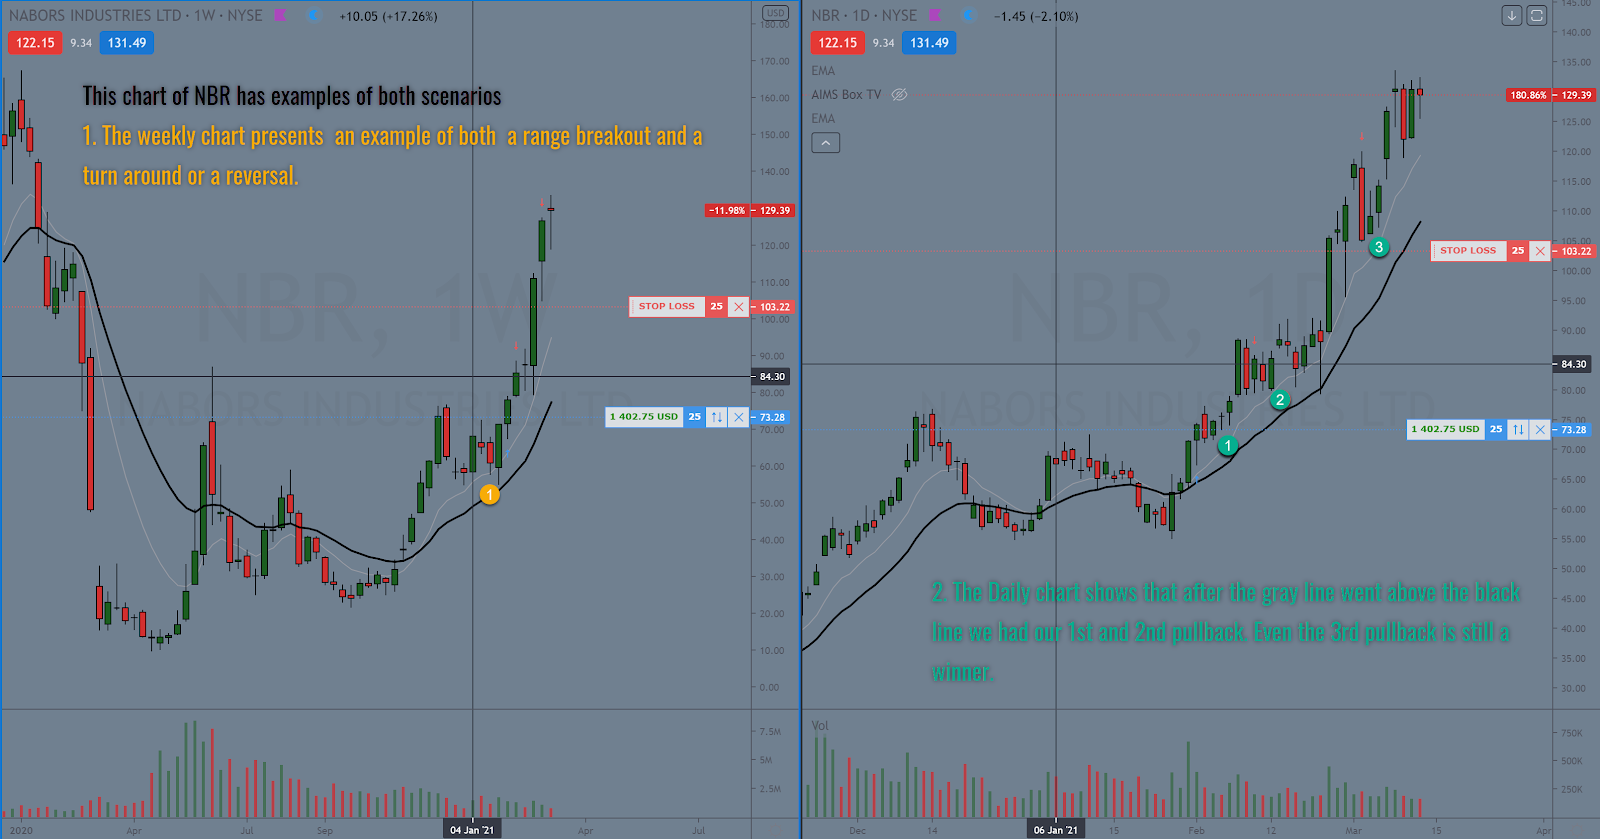
In the picture you see a chart with 10 ema in gray colour and 20 ema in black colour.
1. The EMA has crossed here. That's where the EMA's confirmed the uptrend.
2. Price crossed above the 10/20 EMA after which it pulled back to it. This is your first pull-back after the cross over
3. This is probably the 3rd pull-back but I have deliberately ignored the 1 candle pull-back to the left marked with a small arrow.
4. and 5, are perhaps the same wave but I can mark them as 4th and 5th separately. They seem to have worked in this instance and it's not uncommon in a strong bull market that we have seen since March 2020.
https://www.screencast.com/t/7I8TUehqknUa

Number 2: The Setup
The second one is perhaps very easy because you get a lot of help from the pattern that you understand pretty well already.
We know that when the gator sleeps, and AIMS Wave is close to the Zero line… price is stuck inside the box we know setup 1 might be happening.
Counting Pullbacks within Wave 5:
Assuming you understand the Setup 1 pattern then you know that when price breaks the box and begins to move into wave 5, the first pullback towards the green line of the gator will be considered the first pullback.
Setup 0 / Saddle Point Breakout - NEW WAVE 3:
Now if you are looking at an overall market with no clear wave you’re in a range. Mark the Range Highs and lows. Suppose it breaks out above the range high, you start to see the first Big peak of the AIMS Wave … (AO)... It will usually pullback to the range high.. Here you have the first pullback.
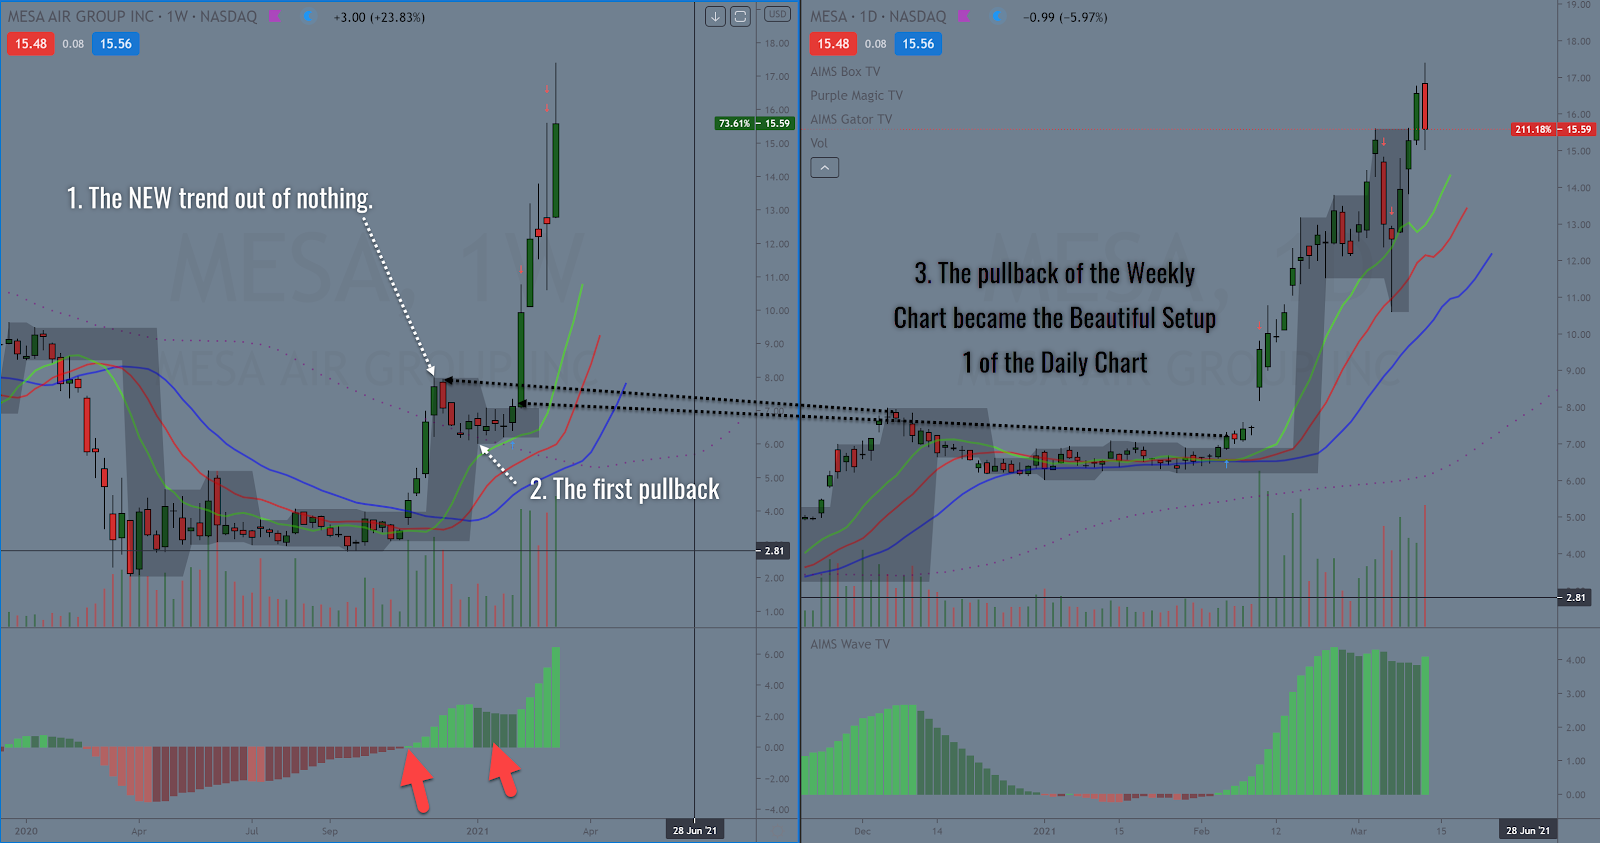
In the picture below you see a perfect setup 1:
Gator is sleeping, price is boxed
AO is Close to ZL freshly cross above zero lines (turning green)
Gator is opening now as price goes into wave 5
This is your FIRST pullback
2nd pullback, only 1 candle so not the best but that’s a different setup we call the Waltz
That’s really your 2nd pullback. Notice that price has already gone far up and you can assess that by the distance it’s travelled away from the initial break, and the peak of AO from when it first crossed above the zero lines. Also, you know that here we apply the concept of Target Zone 1.
https://www.screencast.com/t/qrX5bI4sQsvy

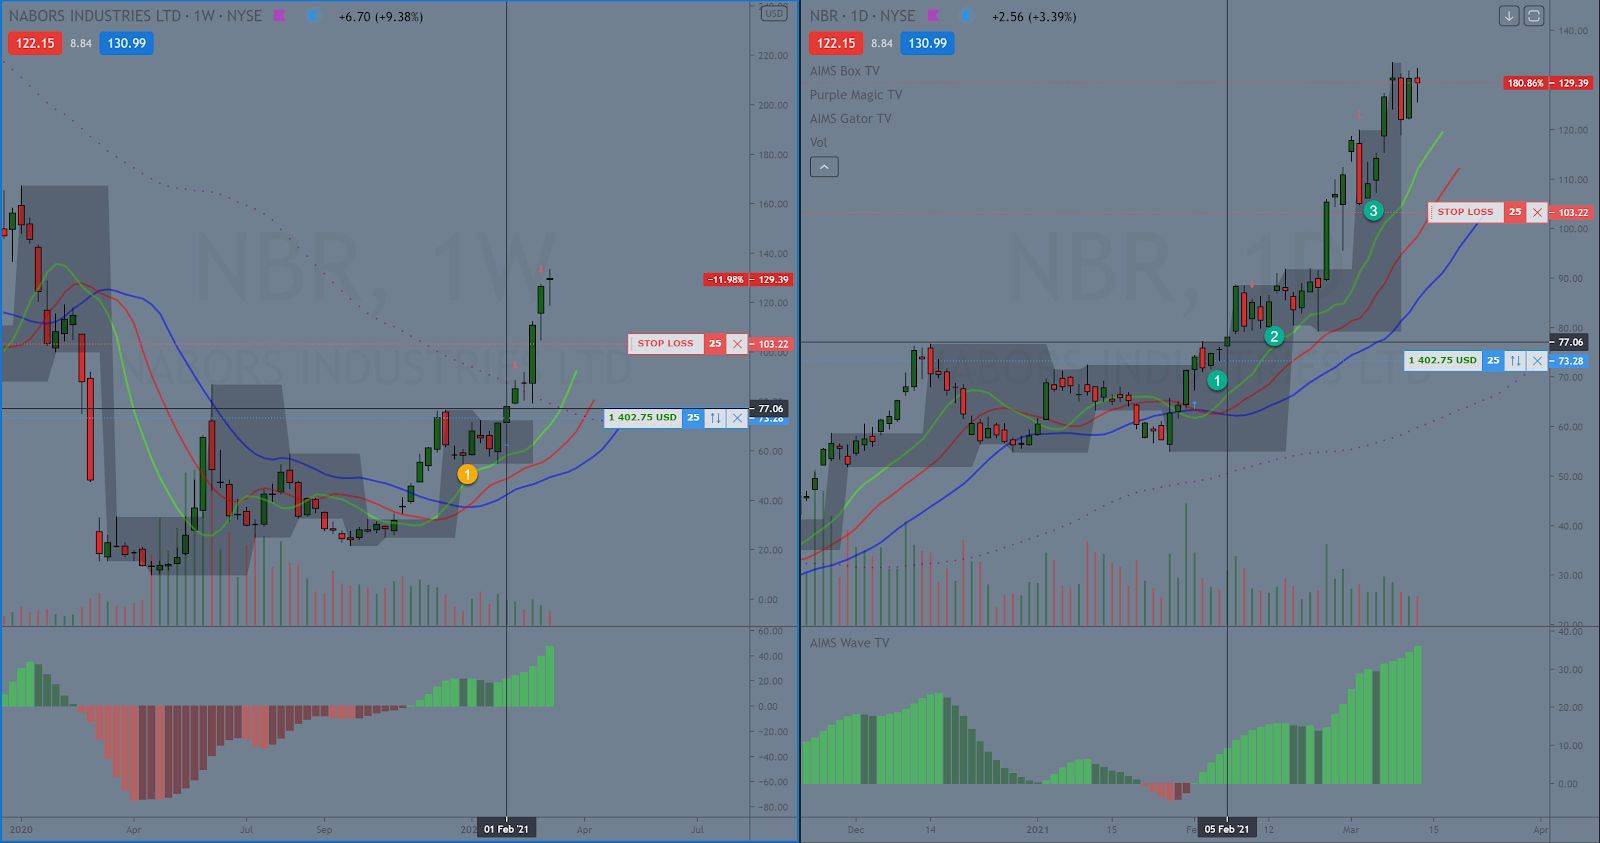
Below now let’s look at the same chart I showed earlier for the 10/20 EMA cross over. Only this time you see it using The Setup template. You can see now how eWave or AIMS Wave or AO oscillator can come in handy.
https://www.screencast.com/t/WDdgt8H8g

The Hunt 1.0 (The original Hunt Method with Keltner Channels)
This is relatively simple.
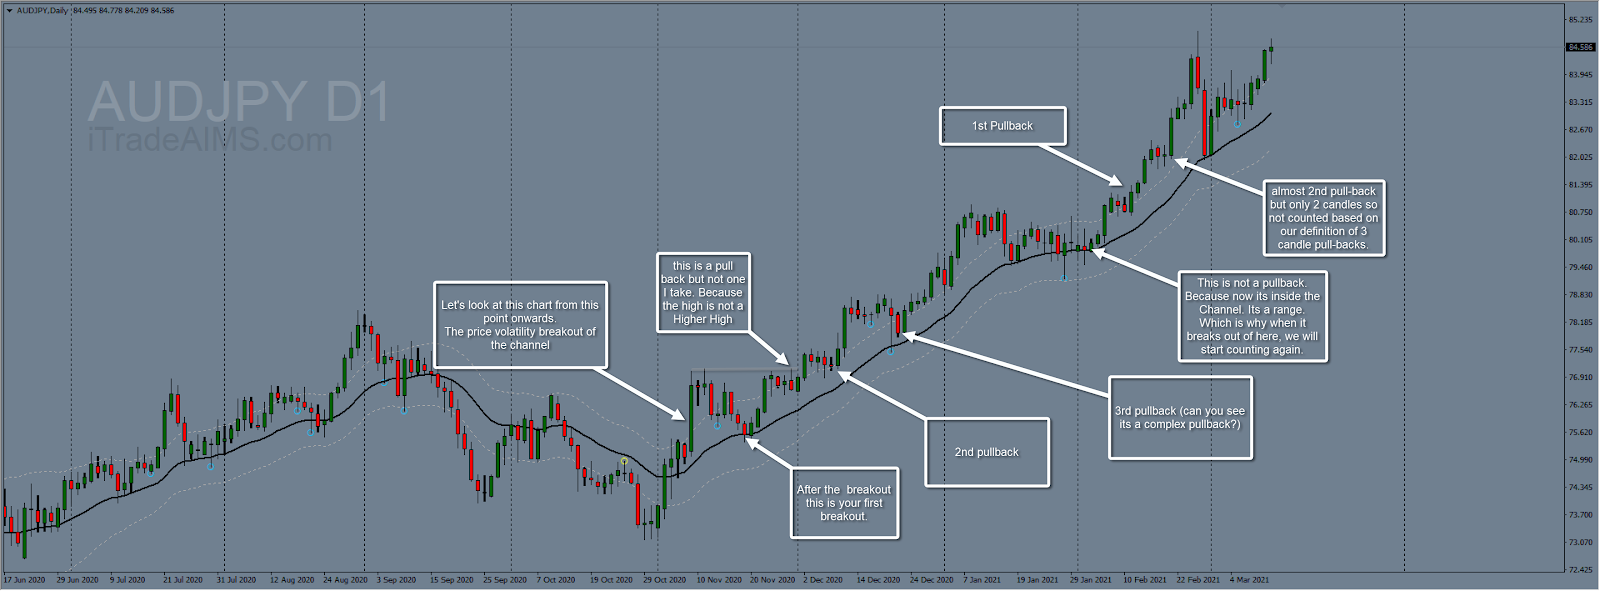
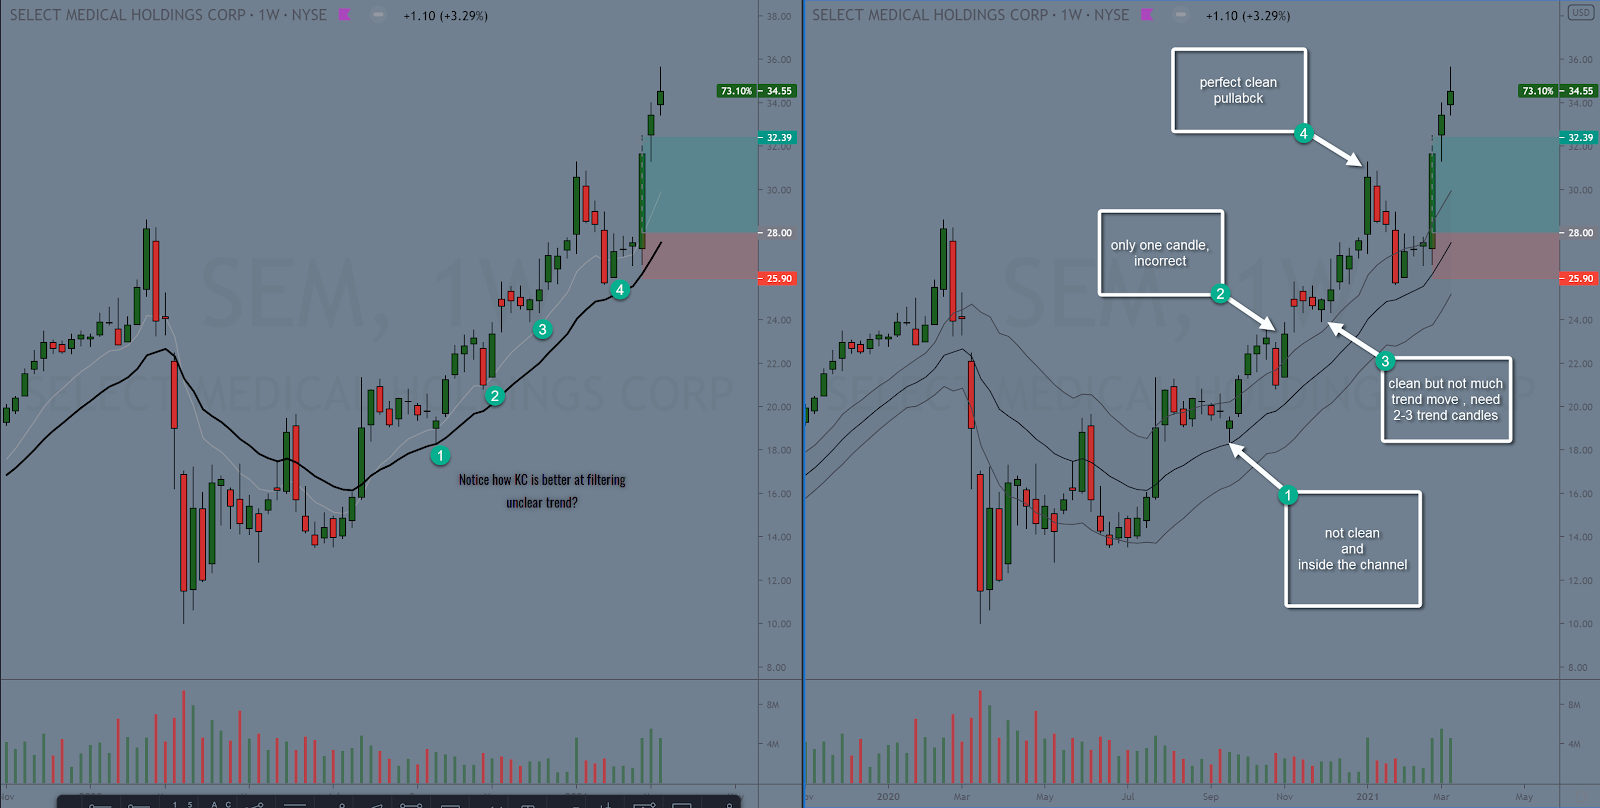
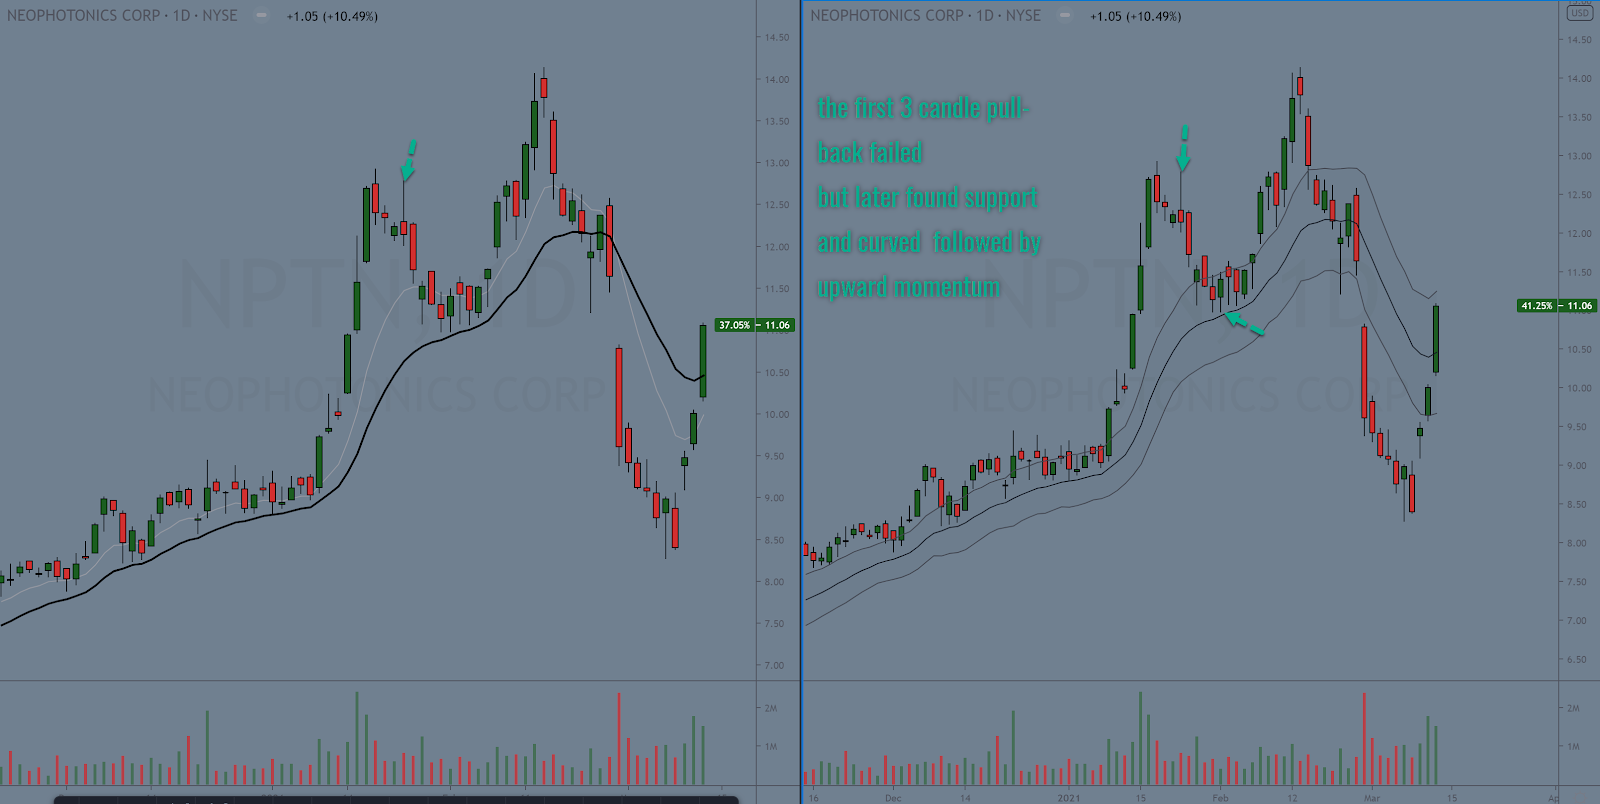
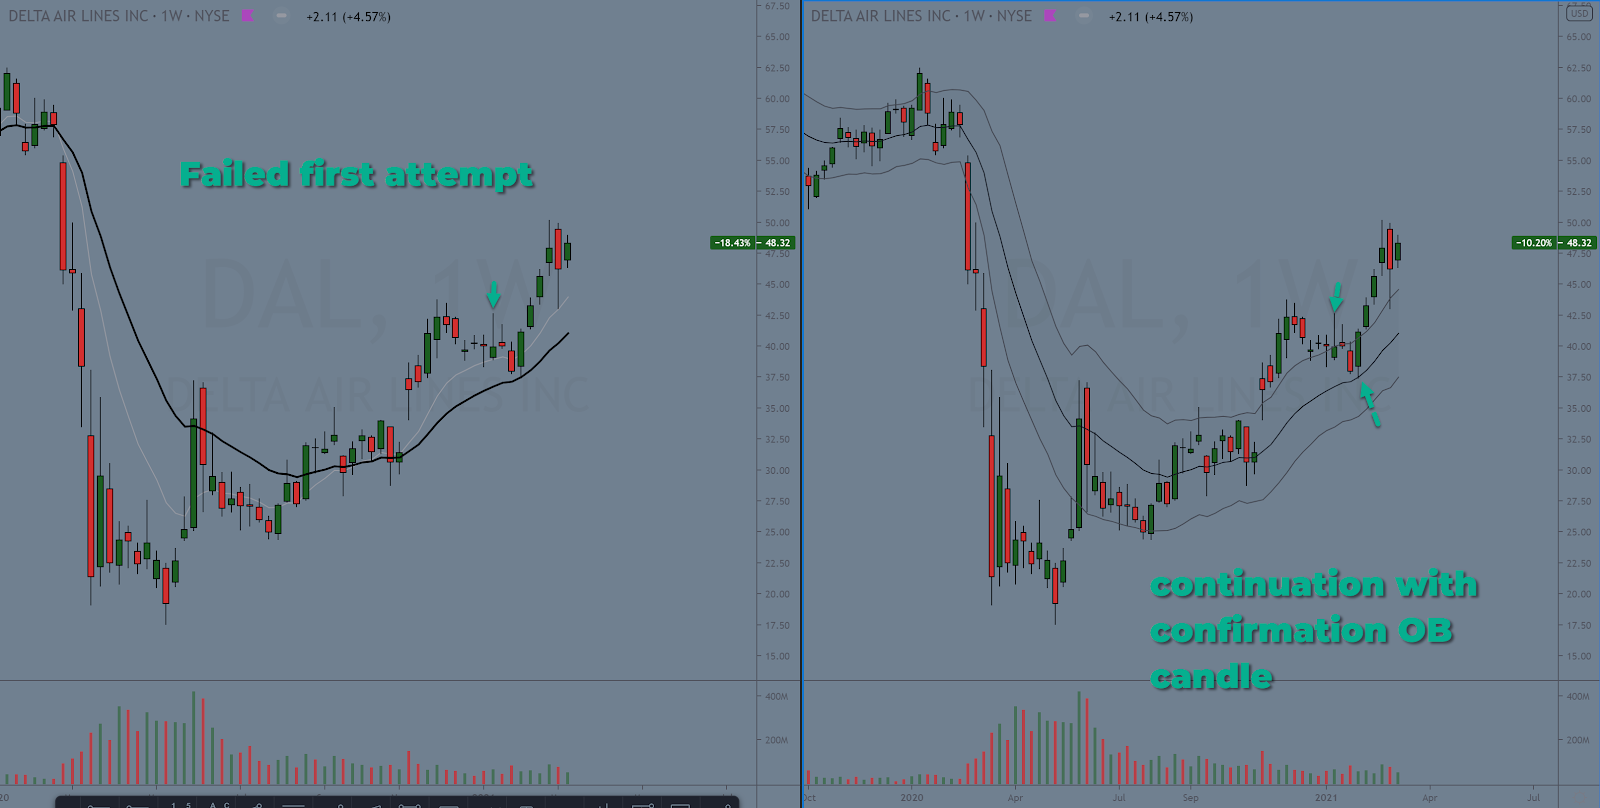
Start counting from where price FIRST broke outside of the Keltner Channel. And then count pullbacks using the definition of a pullback. Yes, tha’ts right, you want at least 3 candles.
I suggest you blow this picture up and study it well. The annotations will help. (I hope)
https://www.screencast.com/t/TSlpe2Sefm (Click on the link to see the bigger picture )