Search This Blog

Showing posts with label eWave. Show all posts

Saturday, 28 September 2019

Why We Stopped Using AO The Awesome Oscillator Despite the Fact its Worth 7 Figures

In This Video: Why We Stopped Using AO The Awesome Oscillator Despite the Fact its Worth 7 Figures

This is the Story of the Humble Oscillator 

How an Oscillator Changed the Industry

How a simple moving average crossover can become such an amazing indicator. 

First I’m going to Introduce the AO

Then I’m going to Explain the AO and take you through the internal structure of the AO.
The skeleton of it if you like, oh, like the doctors say, we’re gonna look at the Anatomy of AO. 

In fact that could be a great title for this video. The Anatomy of AO. 

Second, I’ll go into how we arrived at the AIMS Wave indicator and Lastly, we will explore
the advanced version of AISM Wave, the AIMS eWave. 

So let's begin.


Lets first Install The MT4 Standard Indicator called the AO. 

AO stands for Awesome Oscillator. Bill Williams introduced this indicator in their original course and
called it the Awesome oscillator because according to Dr. Wiliams this is like “tomorrow’s' Wall
Street journal”. (Check out the Famous Setup for this) 

He found that this indicator can plot a perfect elliott wave count without learning the complex way
of counting the wave introduced by the founder of Elliott wave who named it after himself, humble
guy indeed. So Mr. R. N Elliott thought the Market is an intricate mesh , kinda like a Lego work
of waves that fall into two main categories.

The market i.e the chart is made of impulse and
corrective waves. And that impulse waves have 5 waves inside them but the corrective  waves
have 3 waves inside them. Stop stop stop. Its already getting complicated…

Forget that…let's cut to the chase… 

You should know if you’ve read about the “The Elliott Wave Theory” that
the meat of the move is in the impulse waves. And Everyone wants to HIT the WAVE 3.
You know why? 

Because Wave 3 is the biggest portion of a strong trend. So logically everyone wants
to traded wave 3. 

What if I were to tell you that the traders who chase wave 3’s almost always miss the
move because they look for the wave within the sideways markets. 

A Wave 3 is kinda like a seed that is buried under soil. But that there is a bunch of seeds
spread across the field and you don’t know which one will germinate first. Which one
will popup tomorrow and turn into a seedling. So you start digging for seeds.

Now that’s not a good idea is it? Because this could destroy the seed. So you wait. 

Most traders waste their time and money chasing the Wave 3 or finding the wave 3.
What we have found in the last 10 years of trade is that chasing the wave 3 is going to
make you lose a lot of money.  Because Wave 3’s grow out of dirt, that is the sideways
market, and that means trading breakouts out of “no Trend Zones”. The clusterfuck areas,
you know, the charts that look like poop.  

So what is the solution? What we have found is that the best way to trade the wave is to
let the 3 happen, wait for 4 and Trade Wave 5. Because if there is a 3 and 4 there will
almost always be a Wave 5. But if you try to trade wave 3, you have to find wave 1-2 and
that is the hardest thing to do, especially on the lower time frames. Why make things
difficult if there is a simpler solution available right? 

The approach we take is trading the wave 5. There are several benefits of this. Wave 5
can be predicted with 80% success rate. The risk of taking the trade is minimal and the
reward is 3-5 times over. Risk a dollar for 5 dollar return. Cool.

So what about AO? Yes, the AO. Dr. Williams found that you can spot and count the waves,
simply by looking at the peaks and bottoms created by THIS indicator. 

Check out This Video I post earlier about AIMS Wave. 
https://youtu.be/1ilMSBCfJ6U


==================================================

Monday, 22 May 2017

Mickey Wrote a VERY LONG post [Trading Edge]

I just read Mickeys longest post today. That was some read and took a while. My usual time allocated to a forum post is 1-2 minutes at best. This took 10. :)

Link to the post here [members only]

I had to stop and think. Well one thing is clear Mike can write. He is the writer among us for sure. That award goes to him. The pen of trading.

There are many things he talked/wrote about. It was a long post and I do recommend reading it. However, my conclusion is this.

Mickey keeps searching for new indicators and strategies or so it appears to be the case. But perhaps he's still stuck to one or 2 methods that he trades. But in this post I could finally understand why he keeps adding removing indicators. He just plays around with it. And I think there is nothing wrong with it besides waste of time. Time is precious.

There is a question of a trading edge. How do you get one?
Random combinations adding and removing indicators is not the way to find your edge. An edge would be formed only when you do an extensive back-testing of a trading method. And yes that might, at some stage involve adding removing indicators. But what is the purpose of this exercise?

 e.g. AIMS method focuses on the core idea that the market has a structure. Its not a structure that is similar to an engineers blueprint of a skyscraper or an amazing bridge.  The human designs mostly have boxes, correct angles, straight lines, perfect spheres and such, but nature has a more "chaotic" design. The science of chaos has now revealed to us that what might appears to be very random, which we often confuse with noise, actually has an underlying structure. And a structure has rules. Though Chaos has "chaotic rules". So rules mean "constant and rigid" in the normal geometry and mathematics. Here the sum of all three angles of a triangle is always equal to 180 degrees. Unfortunately this applies only to us mere mortals on earth. In space, e.g. the sum might be greater or less than 180. Its Chaos.

[Designers has started using AI for creating the most robust most efficient structural designs for buildings and cars etc. And what amazes me is that the AI designs surprisingly  look quite similar to the structures we see in nature. e.g. the design of a chassis of a modern 3D printed car might look exactly like the structure of the bone. Efficient design means one that is the strongest, lightest yet uses the least amount of material to build. Nature seems to be very good at that]

anyway back to earth and trading.

Here is an interesting opinion of mine: don't laugh. ok.
Almost all indicators at the bottom are useless. YYes, they are, unless you have one that has other meanings to it. One that is more than just the red and green bars or cross over of two lines.  e.g. eWave is the only indicator that I would use because its not merely a signal generator or confirmation of a signal. Lets first learn about the AO a littel but. or AIMS Wave Indicator. 

History of The Awesome Oscillator 
Before AO got its fame, there was another indicator that did nearly the same as the AO but it was much more complex. It actually really highlighted something very important in the market. But you need REAL market data for that. You needed the most important data that futures and shares market need. VOLUME. It was the Bill Williams indicator he named THE MFI. (market facilitation index). It did volume analysis. But Bill found that you can do the same analysis with less effort plus count waves using AO. So MFI was dropped. [Just like that, we can actually drop the gator for AIMS box. With box you can literally kill to birds with one stone.]


The AO or the more advance form of AO i.e. AIMS wave or even better Snorms eWave [or even better Snorms eWH] is our mechanism to highlight the wave structure or shall I say, smooth out the edges of the chart and give us a different smoother picture of the underlying structure of the market.

It unveils the "underlying" wave. Everything in the universe is Energy, and energy follows the path of least resistance. And that path of least resistance is set out by an Underlying usually unseen "structure". 

In human geometry its straight lines and perfect spheres, in nature, its not that. Its wiggly jiggly dingle chops.

It mostly appears to be very random chaotic patterns. The branch of a tree just grows this way or that way. Water flows in random fashion. But Nature has an underlying usually unseen structure that governs the behaviour of most things.

Take of example the the riverbed that governs how the water at the surface will behave. Think about a rive in the mountains, how violent and energetic it is now think about the wide slow moving calm and relaxing river in the plains. Its all to do with the underlying structure. the Riverbed in this case is the underlying structure.

So what is the structure of the market?. The river is made of trillions of molecules of water. And the river bed is made of rocks in the mountain and soil and mud in the plains.

What is the market made of? Millions of orders? correct. Who create those orders? Humans or human created machines? Correct. What goes through a machines mind? Exactly what the human coded into it. Where did that code come from? The Human mind indeed. So does it make sense to assume that the structure of the market is based on the structure of the human mind/brain? = Elliott Wave analysis.

So back to AO.

Price might go from 1000 to 1500 in a month a week or a day. it does not matter to AO. AO literally takes the price change out of equation and focuses on the momentum of price. And Elliott wave analysis is really the analysis of momentum of waves.

AO has uniformity to it. In a way its stuck to a ZL and thus it stays uniformly where it is most of the time. That makes the Elliott wave count effortless and far more effective than the elaborate and tedious work of an Elliotticion. (whew). Thanks but no thanks Robert Prechter. We have AO, the 10 Seconds to Elliott Wave mechanism.

Enough about AO, I hear. I know.

So why do we use AO, well the above might be some short intro to it. It gives us an edge. But how do you calculate an edge? that is the question. And you do that by systematically testing the idea. If you sit down today, put the setup 1 or the Hunt template on. Start from the 1st of Jan 2016 or even the 17, and start to look for Setup 1, apply the entry rules, apply the trade management rules, in short your trading plan, in simulation you will find out what is your edge.

But back testing is hypothetical data and the past is never the indication of the future. The future might be completely different. Well then forward test it.

How to forward test the idea. You will take 100 trades. Record its outcomes and then run some simple analysis on it e.g. how many were winners, how many were BE and how many hit the SL. You can then apply this to a dozen more charts on the same time frame. These would be your individual test and finally you can put the data of lets say 10 pairs and find the results. It will give you a huge insight to your method. And perhaps help increase your "confidence" in what you're doing. In fact, this act should be an AIMS Ritual, rather a TRADER's Baptism if I may say so.

hope this useless post is not as useless as I think it is...

peace

Monday, 28 April 2014

The Opportunity is NOW HERE

Would you like to know how well AIMS Stress Free Trading works on Indices? It will Blow Your Mind!

We make 50-100 pips daily trading German Dax30. Its is a Index based on 30 top German companies. As top as German companies are, such as #BMW, #VolksWagon, #Addidas, Deutch Telekom and Siemens, the DAX Index is Top Top Rated for AIMSters. It is so easy to trade. We love it!

Join AIMS Stress Free Trading Premium Membership Today and Find out how to make money TAX FREE! Click on Buy NOW 


Below Some Trades on GOLD! AIMS Stress Free Trading is The Structure of The Market. IT works on Any Chart, Index, Stock or Currency Pair. We just need two things. A chart that moves and spread that is affordable. More on this on the other side...


Short Signal on Facebook


Thursday, 20 March 2014

The Power of eWave - Predict the Markets in style

Hi 
Today I share with you, once again, the power of eWave. Please read below to learn how powerful this indicator is. It is something you need right now if you want to be able to tell in advance where the next move is going to be. Interesting isn't it? 


Please click on the image below to see a full screen or  bigger  picture to fully appreciate the picture. 


Please check below picture posted by one of our AIMS members in our Secret AIMS Forum for members only. He has nailed it properly. 3 Cheers to him. This concept gives you an 80% chance of success.


Oops Not a Member? 

If you are not a member of AIMS Stress Free Community

We present to you a simple strategy that works and it works brilliantly. JOIN NOW

Thursday, 6 February 2014

The Japanese Princess is our favourite!

Euro Yen #eur/jpy or The Japanese Princess is one of our favourite pairs for our unique scalping strategy that we have applied to trading the forex markets since 2009. Look at this amazing trade today. The entry was spotted using our proprietary indicator we like to call #aimsbox

Cutting the long story short, this trade was taken with a 7 pips stop loss. As I write , (ready for bed) the trade has accumulated over 100 pips and still rising. What a lovely and easy peasy way to make pips...

EUR/JPY News Strategy Trade. One of our 4 Strategies.  Join Today and Start making pips! 


Oops Not a Member? 

If you are not a member of AIMS Stress Free Community
We present to you a simple strategy that works and it works brilliantly. JOIN NOW


Wednesday, 23 October 2013

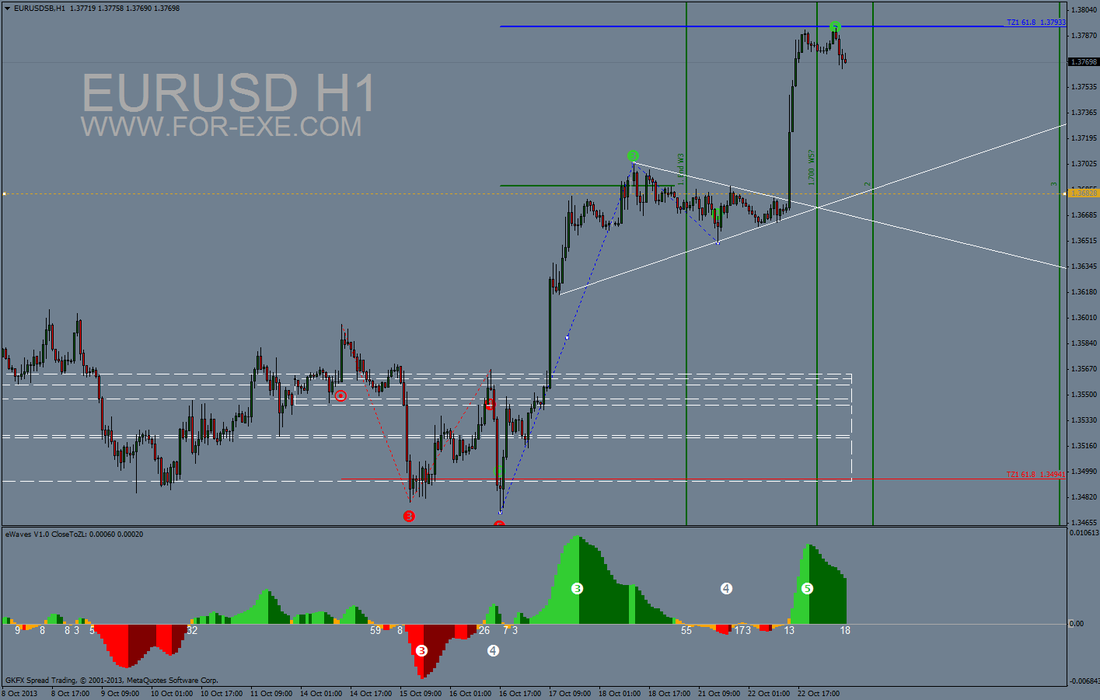
eWaves and NFP - Magic Happens with eWaves

Hi

You know we have an extra indicator based on #AIMS Wave and the concept of #ElliottWave. We have an eBook, available to our Premium Members called 10 Seconds to Elliott Wave. #10sElliottWave. This
concept has changed our trading forever and its something we cherish the most. It makes our job a lot easier.

Steve of www.For-Exe.com went on and created an indicator which we call Snorms eWave. That as you may know, has cut our work further down. So now we call it 1 Second to Elliott Wave. As all you have to do is have a glance at the eWave histogram and you'd know which wave you're looking at and what to expect next. Steve made a lovely post the other day, prior to #NFP and I only wish I had looked at it in time, so that I could have added it to my previous post. But hey, its never too late. Please following this link and have a look http://www.for-exe.com/2/post/2013/10/ewaves-and-nfp.html

ps: Steve is kindly giving 25% discount to #AIMSPremium Members... go get em buddies!

eWaves still amazes me on a daily basis... simply fantastic "leading" indicator. 
#AIMSForum #Forex #Trading #Snorm #AIMS #eWave #eWaves #ElliottWave

When is it too late or too early to buy a pullback? 

In order to answer this question first ….  Let’s quickly do some repetition. Let’s quickly do some repetition.  Let’s throw in some trading ...